Fingerprint Identification Analyzer Guide
This topic provides an overview of the Fingerprint Identification Analyzer (FIA) tool for Imprivata OneSign and how to run a fingerprint analysis.
You can use FIA to create reports that analyze your organization's fingerprint log files in the event that users in your organization are experiencing unsuccessful fingerprint login attempts. FIA analyzes a variety of data for successful and failed fingerprint logins during a specific time period. Data can be returned for all users and computers, for a list of specific users, or for a list of particular computers.
For example, you can configure FIA to create individual reports that analyze each of the top 20 computers in your network on which users are experiencing issues logging into Imprivata OneSign via their fingerprint. You can also choose to save JPG image files of the fingerprint login attempts that occurred during a specified time period.
The following sections describe how to verify use requirements, run a fingerprint analysis, and interpret the findings produced in the analysis.txt file.
Java Version 1.7 (64-bit)
- Go to http://www.java.com/en/download/manual.jsp.
- Click Windows Offline (64-bit) to download Java 1.7 (64-bit).
Imprivata OneSign 4.5 or Later
It is strongly recommended that FIA be used only to analyze the log files and databases in organizations using Imprivata OneSign 4.5 or later. FIA may produce results for earlier versions as well, but changes in the log file formats from pre-4.5 may cause errors during analysis.
FIA Files
Imprivata Services will provide customers with the files for running FIA.
To run a fingerprint identification analysis:
- Run FIA.bat to open the Fingerprint Identification Analyzer. The Fingerprint Identification Analyzer window opens.
- Enter the parameters and settings for the analysis job. The following table lists and describes the fields in the FIA window.
-
Field Description Files to Analyze area: Logfile Directory Browse to the location of the log files that you want FIA to analyze. Logfile Type Select the type of log file to analyze: fingerprint.log or system.log.
Fingerprint.log files are preferable because they include more data.
NOTE: For System.log files, the server must be in DEBUG mode.
Timeframe area: Start Date The date on which FIA begins collecting data from the log files. If you do not enter a date, then the analysis begins when the first login is recorded in the log files. End Date The date on which FIA stops collecting data from the log files. If you do not enter a date, then the analysis ends when the last login is recorded in the log files. Configuration area: Number of Users to Rank / All Users The number of users you want FIA to rank in sections 6 and 7 of analysis.txt based on their success.
Select All Users if you want all users to be ranked.
Number of Computers to Rank / All Computers The number of computers you want FIA to rank in section 8 of analysis.txt based on their success.
Select All Computers if you want all computers to be ranked.
Seconds Before Successes The maximum amount of time, in seconds, that can occur between a successful login and a preceding failed login attempt for the two events to be associated with the same user. This information is recorded in all sections of analysis.txt that try to match a preceding failure to a success. Create an Analysis for - All Users and Computers — FIA analyzes all login attempts in the specified log file.
- Each of these Users — FIA creates an analysis folder for each user you enter (comma-separated list of user names) in the box to the right of the field.
- Each of these Computers — FIA creates an analysis folder for each computer you enter (comma-separated list of computer names/host names) in the box to the right of the field.
Advanced Settings area (Fingerprint.log only): Advanced Settings If selected, then an analysis of the template data for the log files analyzed (section 14) is printed, and the following setting is enabled. Number of Image Pairs / All Images The number of images or image pairs (successes and preceding failures) that you want to include in the Images folder.
NOTE: The images included in FIA analysis files are not the original images captured when you enrolled your fingerprint using a fingerprint reader; rather, they are a visual representation of the data points used to match fingerprints to one another.
If Only this Computer is selected, enter the number of total images you want.
Select All Images if you want to include all image pairs.
Results area: Folder Name The name of the folder to which analysis results will be saved. The folder is created in the current directory.
The folder will contain the following:
- analysis.txt — Contains all fingerprint analysis data.
- consolidate.txt — Contains all login attempts.
- Images folder — If you opted to record any images, then .jpg versions of the images will be stored in this folder.
- vectors.log — Contains the vectors used to make the images in the Images folder.
- Click Analyze. The analysis folder you specified is created and the FIA will notify you when the analysis is complete.
- Click Exit when you are finished.
The following information describes the sections of the analysis.txt file that is created when you run an analysis using FIA.
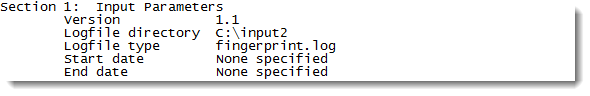
Section 1 displays:
- The current version of FIA.
- The specified input directory.
- The type of log file(s) selected.
- The start and end dates you entered.
The following image shows an example of Section 1 of the Analysis.txt file:
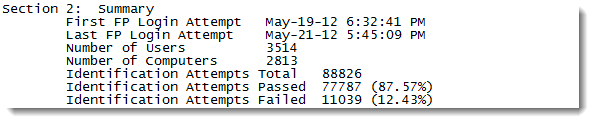
Section 2 displays:
- The first and last dates of the login attempts analyzed.
- The number of users and computers included in the analysis.
- The numbers/percentages of login attempt passes and failures that occurred during the analysis time period.
The following image shows an example of Section 2 of the Analysis.txt file:
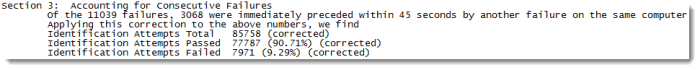
Section 3 displays the number of failures that were preceded by another failure within 45 seconds on the same computer. This number is then subtracted from the total number of failed logins to provide a more accurate representation of successful and failed logins. This figure is considered to be a "corrected" version of the results displayed in Section 2.
The following image shows an example of Section 3 of the Analysis.txt file:
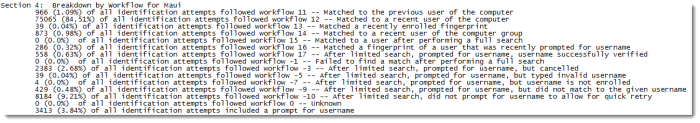
Section 4 displays the number of fingerprint identification attempts that followed each workflow type as described to the right of the number. A positive workflow number indicates that the login was successful, and a negative number indicates that the login failed.
This section also displays the total number/percentage of identification attempts that included a prompt for a user name.
When there are over 4,000 fingers enrolled in an enterprise, workflow -1 will never be encountered because Imprivata OneSign will never perform a full search. When there are fewer than 4,000 fingers enrolled, Imprivata OneSign will always perform a full search if it cannot find the user by any of the previous workflows.
The following image shows an example of Section 4 of the Analysis.txt file:
Section 5 displays the number/percentage of users each day that were successfully identified but were prompted at least once to type their user name when logging in.
The following image shows an example of Section 5 of the Analysis.txt file:

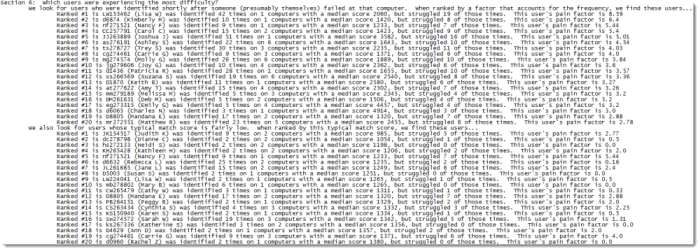
Section 6 ranks the top 20 users (or number you specified in the FIA settings) who struggled the most when trying to log in.
- The first half of the section ranks the users based on a "pain factor;" this factor is a representation of how often they had to retry logging in before successfully logging in.
- The second half of the section ranks users based on their average match score. For each user, this section displays their rank, user name, full name, number of times identified and how many computers they were identified on, their median match score, the number of times they failed to log in, and their pain factor.
The following image shows an example of Section 6 of the Analysis.txt file:
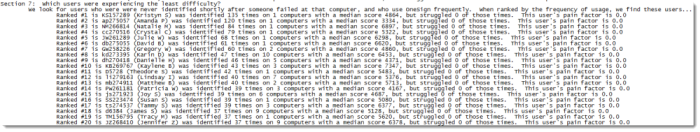
Section 7 ranks the top 20 (or number you specified in the FIA settings) users who struggled the least when trying to log in.
For each user this section displays rank, user name, full name, number of times identified and on how many computers the user was identified, the user's median match score, the number of times the user failed to log in, and the user's pain factor.
The following image shows an example of Section 7 of the Analysis.txt file:
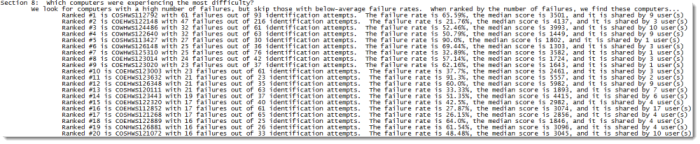
Section 8 ranks the top 20 computers (or number you specified in the FIA settings) that had the most failed login attempts.
For each computer, this section displays its rank, hostname, number of failures out of total identification attempts, failure rate, median match score, and by how many users the computer was shared.
The following image shows an example of Section 8 of the Analysis.txt file:
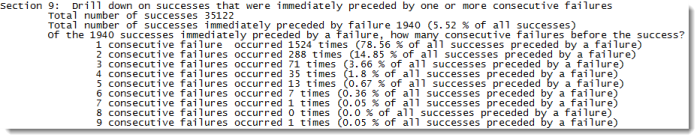
Section 9 displays the total number of successful logins and how many were preceded by a failure within the amount of time you specified in the FIA settings. This section also displays how many of those successful logins were preceded by each number of failures.
The following image shows an example of Section 9 of the Analysis.txt file:
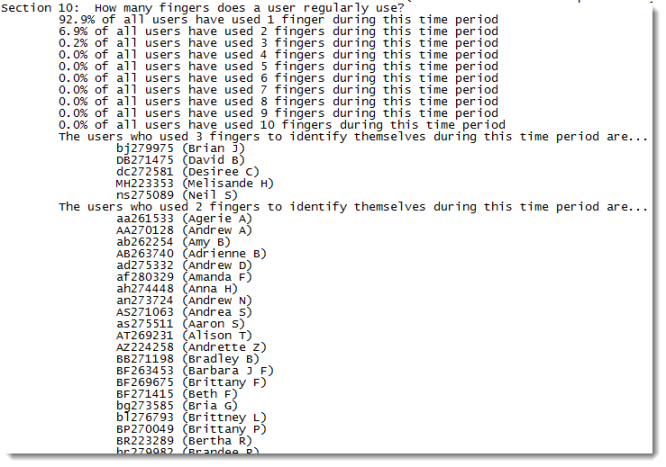
Section 10 displays how many fingers users regularly logged in with during the time period. This section also displays all users who regularly used more than one finger to log in, doing so for each number of total fingers used.
The following image shows an example of Section 10 of the Analysis.txt file:
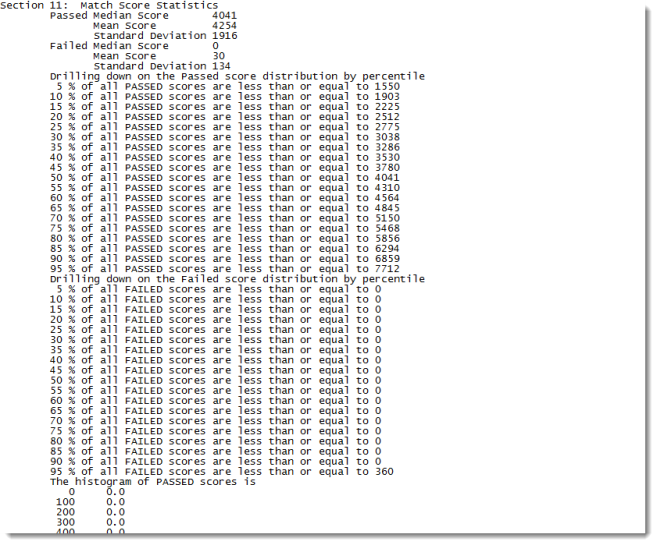
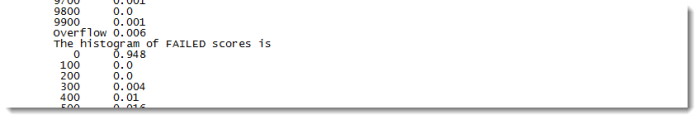
Section 11 displays the total mean and median scores and standard deviation for both successful and failed login attempts during the time period. This section also displays the distribution of these scores as both percentages and histograms.
The following image shows an example of Section 11 of the Analysis.txt file:

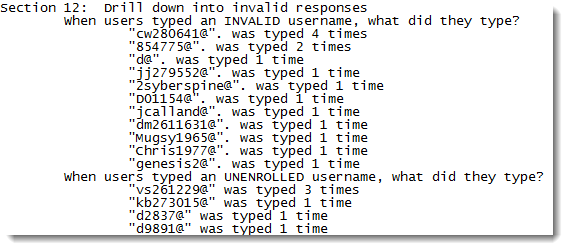
Section 12 displays the invalid or unenrolled user names that were entered during the analysis time period and how many times each invalid/unenrolled user name was typed. This scenario only occurs when a user is prompted to type his/her user name in an enterprise containing over 4,000 enrolled fingers.
The following image shows an example of Section 12 of the Analysis.txt file:
Section 13 lists all log files that were examined during the analysis period.
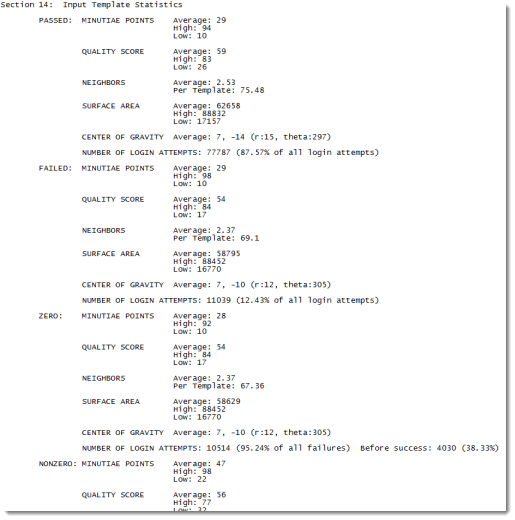
Section 14 is enabled only when Advanced Settings is selected in the FIA settings.
This section displays statistics for the template data provided only in fingerprint.log files. For each login attempt, fingerprint.log files record the image as an "input template" that contains the number of minutiae points (points of significance), quality score (darkness of image), neighbors (coordinates near minutiae points), surface area covered by the fingerprint (in pixels), and center of gravity on the reader (average of all significant points in both Cartesian and Polar coordinates).
The statistics are displayed for the four types of login attempts:
- PASSED — All successes
- FAILED — All failures
- ZERO — All failures with a match score of zero
- NONZERO — All failures with a nonzero match score
The following image shows an example of Section 14 of the Analysis.txt file:
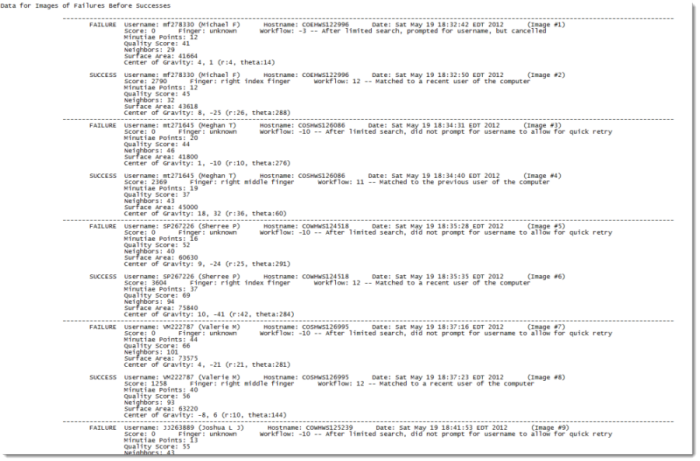
If you opted in the FIA settings to display images for certain transactions, then all data for each of these images is displayed below the Input Template Statistics section. The JPG files for these images are stored in the Images folder that is in the same directory as the analysis.txt file.
"(Image #N)" corresponds to "N.jpg" in the Images folder and to line N in the vectors.log file.
The following image shows an example of data displayed for images of failures that occurred before successes for the same users: